Page 3 of 5
Re: Tonga Eruption
Posted: Sun 16 Jan 2022 6:04 pm
by HansR
Re: Tonga Eruption
Posted: Sun 16 Jan 2022 7:17 pm
by RayProudfoot
This is a good video. I’m sure there’ll be many more in the coming days...
https://youtu.be/zoMRwyNhqJ4
Re: Tonga Eruption
Posted: Sun 16 Jan 2022 9:09 pm
by Gregorean
The volcanic eruption in Tonga was so violent on Saturday 20.00 CET that its effects were observable as far away as the Netherlands. It is the first time that such a phenomenon from so far away could also be measured in the Netherlands.
The first shockwave reached us last night from the east and caused a considerable fluctuation in the air pressure here. Later in the night 02.30 hours CET the shock wave from the west also reached our country. It had been underway longer and had already lost power, so the fluctuations in air pressure were less. Nevertheless, the air pressure was significantly disturbed during the night."
pressure.png
Re: Tonga Eruption
Posted: Sun 16 Jan 2022 9:55 pm
by Ned
Being relatively close to the eruption (2052km according to Goggle Earth) we had a very sharp pressure spike but no noticeable secondary one.
The interval was 123 minutes, which relates to a propagation speed of 1001 km/hr - quite a bit lower than the speed of sound.
My wife heard a series of 7 explosions about an hour later so likely from eruptions following the first one. Many others in NZ reported similar.
I missed that as I was out walking and not being so sharp eared

Re: Tonga Eruption
Posted: Mon 17 Jan 2022 10:34 am
by BeaumarisWX
I suppose I am going out on a limb here:
Though I suppose I am asking for your thoughts on this :
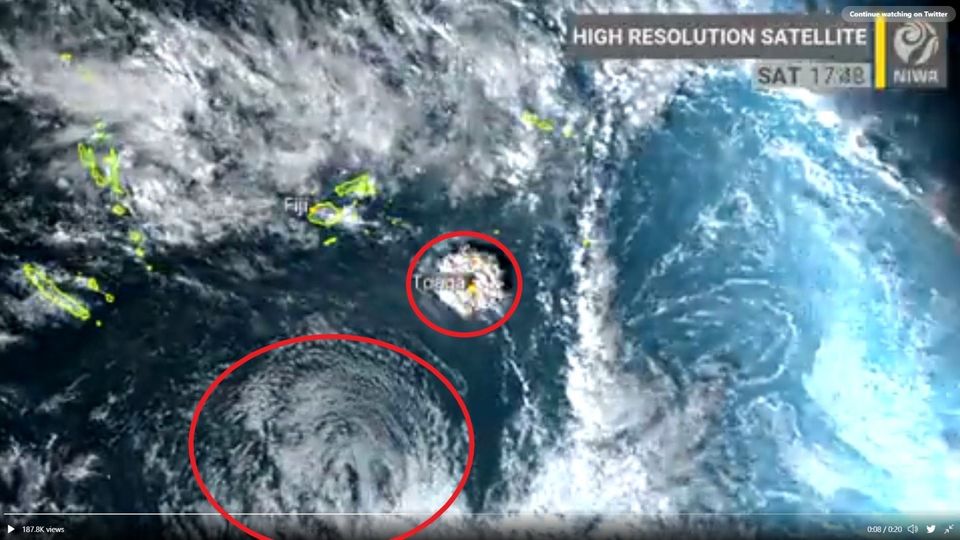
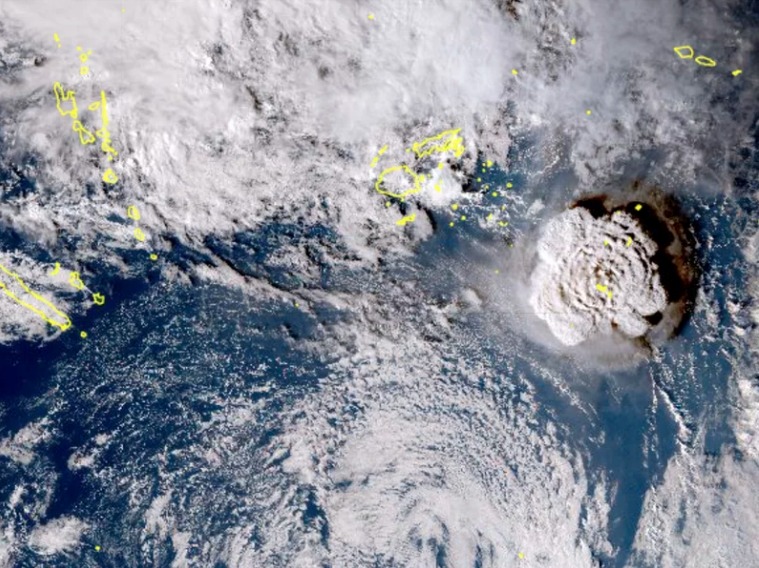
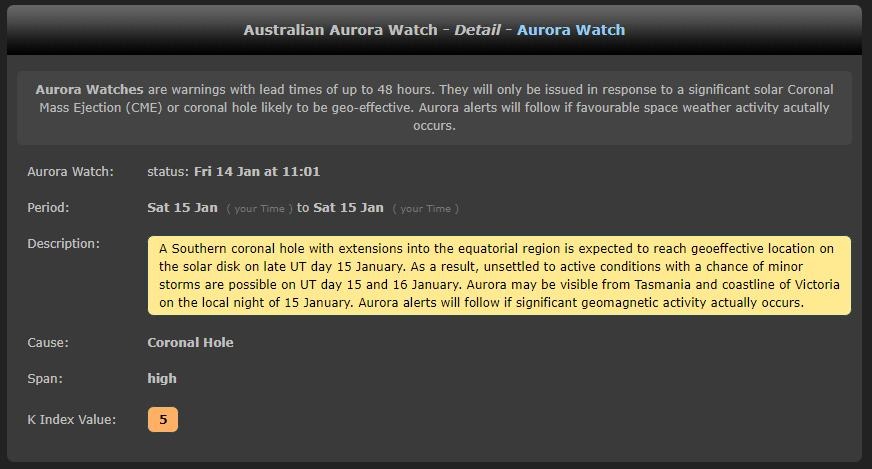
I have spent the better part of my life tracking Earthquakes and Cyclones, over that Time I have found that when we have CME's (Coronal Mass Ejections from the Sun), which some of us love (because it produces Auroras). That however through my monitoring over time I have found that in the event of a said CME, if it coincides with a Low Pressure System (better known as a Cyclone or even just that a Low Pressure System). It results in Volcanic Disturbance. I believe this is what happened with the Tonga Eruption.
You can see in the images attached, the significant Low Pressure System and the Eruption in Tonga. It all culminated around the same Time as the Arrival of the BoM Forecast CME. I am not a Scientist, but one who has observed Facts over time and I do believe in what the stats say.
It dose not always translate to a Volcanic Eruption, as in most cases it results in a maybe small Earthquake.
Kind Regards,
Tonga Volcanic Eruption
Posted: Mon 17 Jan 2022 11:03 am
by BrunswickWeather
Cumulus MX showed the change in air pressure caused by the Eruption near Tonga. I read a report that this was also observed in Scotland.
My location is Melbourne Australia. The eruption occurred at 3:15pm AEDT.
Re: Tonga Eruption
Posted: Mon 17 Jan 2022 11:18 am
by HansR
Hi Tony,
Interesting thoughts!
Nevertheless I have some doubts of the multiple relationship you more or less propose between:
- Solar eruptions (Coronal Mass Ejections, I believe also named solar flares?)
- Volcanic eruptions (or in lesser cases just earthquakes)
- Low pressure systems in the neighbourhood of such geo-activity
Especially a relation between geo-activity and atmospheric activity seems dubious (may cause effect, see below).
But the good thing is: this should give you a great charting opportunity: with time on the X-axis it should be possible to map CME events ( plus intensity), volcanic eruptions and and low pressure distance to such eruption all in one chart (i would leave earthquakes out that would create confusion).
Even volcanic eruptions over time with CME events would already be a great start.
In my idea an atmospheric aberration would more be a result of a volcanic eruption than e.g. a cause. But looking for some relation would start with charting I assume. And then when there is ground for the hypothesis (e.g. a low would always succeed an eruption) you could continue.
Re: Tonga Eruption
Posted: Mon 17 Jan 2022 11:32 am
by mcrossley
I haven't come across that one before.
I have heard about earth quakes/volcanos and full Moon, but the data does back it up from what I saw. That theory seems like another example of our fantastic human ability to pattern match, or rather see patterns when there are none, and remember the coincidences but not all the times when no coincidence occurs.
As Hans says, try and get some more data and see if the correlation is real.
Re: Tonga Eruption
Posted: Mon 17 Jan 2022 11:38 am
by BeaumarisWX
Will Do. Stay Tuned.
Hans :
i would leave earthquakes out that would create confusion
Quakes are an after math of a CME. I an not talking about Volcanic Eruptions, I am talking about the effect of CME's.
The way CME's work is they incite the Earths Core Magma. Which results in it looking for an escape rout Low Pressure areas on Earth are their Escape Rout. Once they find it, the Tectonic Plates reverberate that pressure release around the globe. Beit as a result of an Earthquake or Volcanic Eruption. It's that simple. Though I have observed that in those events a Low Pressure System has been nearby. I have never documented it over time though will do so from now on.
Re: Tonga Eruption
Posted: Mon 17 Jan 2022 5:15 pm
by HansR
I suspect the shockwave even to have travelled a second roundtrip. This should be visible everywhere, at least the stations close to the antipode as we cannot be sure it will be observed again at the other side of the world. It has to die out at some time. From my charts today (and yes, it can also be seen on the interface if required of course):
Schockwave Second Roundtrip.jpg
Re: Tonga Eruption
Posted: Mon 17 Jan 2022 10:33 pm
by Super-T
An echo could be true looking at my graph. Trouble it is hard to imagine as mine are 36 hours apart.
2022-01-18_112921.jpg
Re: Tonga Eruption
Posted: Mon 17 Jan 2022 11:20 pm
by HansR
@Super-T: the pattern for auckland would be much different from here close to the antipode but 36 hours apart would mean a roughly 18 hrs trip for the shockwave from one point to the antipode which is consistent with everywhere else.
As you are actually close to Tonga, the first wave would not supply an echo as it does here at the antipode. Upon return i would expect one though it should have weakened a lot by then. I believe Auckland is roughly 2500 km from Tonga (from my head) so an echo would be a roughly 2.5 hrs from the volcano or 5 hrs distance from the return wave passing. If it's there.
So the anomaly around 6h00 could be it: the first is the echo coming back to its origin, weakenend, the second , stronger one is the new interference wave coming from the volcano. Stronger because of the interference (imagine the wave coming back to a single point and all energy sums up creating the new inrference wave).
Something like that.
Re: Tonga Eruption
Posted: Tue 18 Jan 2022 8:50 am
by ConligWX
freddie wrote: ↑Sun 16 Jan 2022 9:29 am
Same in this part of the UK, with another anomaly just before 0200 UTC.
pressure-20220115.png
Met office readings had 2 drops that evening and apparently all were from the shock wave from the volcano.
FJMIRJcX0AUdopJ.jpg
Capture.PNG
Re: Tonga Eruption
Posted: Tue 18 Jan 2022 1:23 pm
by malkie
A small feature about this “shock wave” was mentioned on the BBC Local News on Monday night, so I checked my CumulusMX graphs and sure enough, there it was!
Re: Tonga Eruption
Posted: Tue 18 Jan 2022 4:24 pm
by Altocumulus
I wanted to check back through the graphs to see if I'd had a similar spike in the data, but on my localhost/charts display I have 12 hours of data on display. Only "All" is emboldened, the other 3 options are greyed out.
I assume there's a way to check back on previous days, or have I lost the opportunity without a lot of work - Historic Charts option is way too coarse.
I've looked back on our seismometer, but nothing appears to show beyond the background noise.