I have a WH1081 station running Cumulus 1.9.4. I have noticed that the graph "pressure" is exactly the same as "inside temp".
Any ideas?
Welcome to the Cumulus Support forum.
Latest Cumulus MX V3 release 3.28.6 (build 3283) - 21 March 2024
Cumulus MX V4 beta test release 4.0.0 (build 4019) - 03 April 2024
Legacy Cumulus 1 release 1.9.4 (build 1099) - 28 November 2014
(a patch is available for 1.9.4 build 1099 that extends the date range of drop-down menus to 2030)
Download the Software (Cumulus MX / Cumulus 1 and other related items) from the Wiki
Problem
-
G0SQLRodney
- Posts: 1
- Joined: Fri 13 Oct 2023 5:20 pm
- Weather Station: WH1081
- Operating System: Windows11
-
water01
- Posts: 3258
- Joined: Sat 13 Aug 2011 9:33 am
- Weather Station: Ecowitt HP2551
- Operating System: Windows 10 64bit
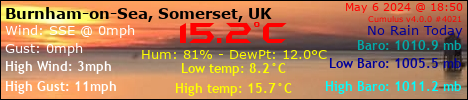
- Location: Burnham-on-Sea
- Contact:
Re: Problem
Problem with weather station? No way of helping you with Cumulus 1 as it is no longer supported.
David
-
RayProudfoot
- Posts: 3390
- Joined: Wed 06 May 2009 6:29 pm
- Weather Station: Davis VP2 with Daytime FARS
- Operating System: Windows XP SP3
- Location: Cheadle Hulme, Cheshire, England
- Contact:
Re: Problem
Got a link to your site?G0SQLRodney wrote: ↑Sun 29 Oct 2023 12:30 pm I have a WH1081 station running Cumulus 1.9.4. I have noticed that the graph "pressure" is exactly the same as "inside temp".
Any ideas?
Cheers,
Ray, Cheshire.

Ray, Cheshire.
-
PaulMy

- Posts: 3852
- Joined: Sun 28 Sep 2008 11:54 pm
- Weather Station: Davis VP2 Plus 24-Hour FARS
- Operating System: Windows8 and Windows10
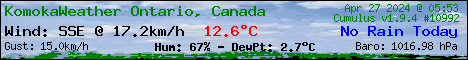
- Location: Komoka, ON Canada
- Contact:
Re: Problem
Hi,
Looking at my CU1 console > View > Select-A-Graph it looks like the combination of Pressure and Inside Temp together do not display correctly. In fact, Pressure together with most other elements do not display correctly. Only one I found showing along with Pressure are Outside Humidity, Solar Radiation, Max Solar Rad. Likely a bug to live with as CU1 is no longer supported as David mentioned.
p.s. in CumulusMX all Select-A-Charts work correctly, including Select-A Period
Enjoy,
Paul
VP2+
C1 www.komokaweather.com/komokaweather-ca
MX https://komokaweather.com/cumulusmx/index.htm /index.html /index.php
MX https://komokaweather.com/cumulusmxwll/index.htm /index.html /index.php
MX https:// komokaweather.com/cumulusmx4/index.htm
C1 www.komokaweather.com/komokaweather-ca
MX https://komokaweather.com/cumulusmx/index.htm /index.html /index.php
MX https://komokaweather.com/cumulusmxwll/index.htm /index.html /index.php
MX https:// komokaweather.com/cumulusmx4/index.htm
-
Super-T

- Posts: 890
- Joined: Tue 09 Sep 2008 3:37 am
- Weather Station: wh-1081
- Operating System: Weather Laptop - Windows 10 Pro
- Location: Auckland, New Zealand
- Contact:
Re: Problem
They look OK for me. The pressure sensor is in the Inside Console so perhaps there is a problem in your Console?
You do not have the required permissions to view the files attached to this post.
-
PaulMy
- Posts: 3852
- Joined: Sun 28 Sep 2008 11:54 pm
- Weather Station: Davis VP2 Plus 24-Hour FARS
- Operating System: Windows8 and Windows10
- Location: Komoka, ON Canada
- Contact:
Re: Problem
HI,
I could be wrong but presumed the poster was referring to the Select-A-Graph where you can select Pressure, Inside Temp, etc. all on the same graph.
I agree that the individual fixed graphs display correctly.
Enjoy,
Paul
I could be wrong but presumed the poster was referring to the Select-A-Graph where you can select Pressure, Inside Temp, etc. all on the same graph.
I agree that the individual fixed graphs display correctly.
Enjoy,
Paul
You do not have the required permissions to view the files attached to this post.
VP2+
C1 www.komokaweather.com/komokaweather-ca
MX https://komokaweather.com/cumulusmx/index.htm /index.html /index.php
MX https://komokaweather.com/cumulusmxwll/index.htm /index.html /index.php
MX https:// komokaweather.com/cumulusmx4/index.htm
C1 www.komokaweather.com/komokaweather-ca
MX https://komokaweather.com/cumulusmx/index.htm /index.html /index.php
MX https://komokaweather.com/cumulusmxwll/index.htm /index.html /index.php
MX https:// komokaweather.com/cumulusmx4/index.htm
-
Super-T
- Posts: 890
- Joined: Tue 09 Sep 2008 3:37 am
- Weather Station: wh-1081
- Operating System: Weather Laptop - Windows 10 Pro
- Location: Auckland, New Zealand
- Contact:
Re: Problem
I've never used Select-a-graph but yes, if you display just Pressure then pressure displays OK. If you display anything else then pressure is just a line at the top of the graph. Looks like a fault that you can work around.
-
mcrossley

- Posts: 12776
- Joined: Thu 07 Jan 2010 9:44 pm
- Weather Station: Davis VP2/WLL
- Operating System: Bullseye Lite rPi
- Location: Wilmslow, Cheshire, UK
- Contact:
Re: Problem
Won't you need to put temp and pressure on opposite y-axes (L & R) to get the scales correct?
-
PaulMy
- Posts: 3852
- Joined: Sun 28 Sep 2008 11:54 pm
- Weather Station: Davis VP2 Plus 24-Hour FARS
- Operating System: Windows8 and Windows10
- Location: Komoka, ON Canada
- Contact:
Re: Problem
Yes Mark, you are correct, selecting one as R and the other as L and then both display correctly. I need to clean my glasses as I missed those L and R options. Also should have known Steve would not have that kind of bug or error for very long 
Enjoy,
Paul
Enjoy,
Paul
VP2+
C1 www.komokaweather.com/komokaweather-ca
MX https://komokaweather.com/cumulusmx/index.htm /index.html /index.php
MX https://komokaweather.com/cumulusmxwll/index.htm /index.html /index.php
MX https:// komokaweather.com/cumulusmx4/index.htm
C1 www.komokaweather.com/komokaweather-ca
MX https://komokaweather.com/cumulusmx/index.htm /index.html /index.php
MX https://komokaweather.com/cumulusmxwll/index.htm /index.html /index.php
MX https:// komokaweather.com/cumulusmx4/index.htm