Any idea why my pressure graph is looking so blocky as compared with temperature for example?
Welcome to the Cumulus Support forum.
Latest Cumulus MX V3 release 3.28.6 (build 3283) - 21 March 2024
Cumulus MX V4 beta test release 4.0.0 (build 4019) - 03 April 2024
Legacy Cumulus 1 release 1.9.4 (build 1099) - 28 November 2014
(a patch is available for 1.9.4 build 1099 that extends the date range of drop-down menus to 2030)
Download the Software (Cumulus MX / Cumulus 1 and other related items) from the Wiki
"Blocky" Pressure Graph
- steve
- Cumulus Author
- Posts: 26701
- Joined: Mon 02 Jun 2008 6:49 pm
- Weather Station: None
- Operating System: None
- Location: Vienne, France
- Contact:
Re: "Blocky" Pressure Graph
Oregon Scientific weather stations have a pressure resolution of 1 mb. The temperature resolution is 0.1 C.
Steve
-
- Posts: 556
- Joined: Fri 08 May 2009 3:12 pm
- Weather Station: Davis Vantage Vue
- Operating System: Windows 10
- Location: Pembrokeshire West Wales UK
- Contact:
Re: "Blocky" Pressure Graph
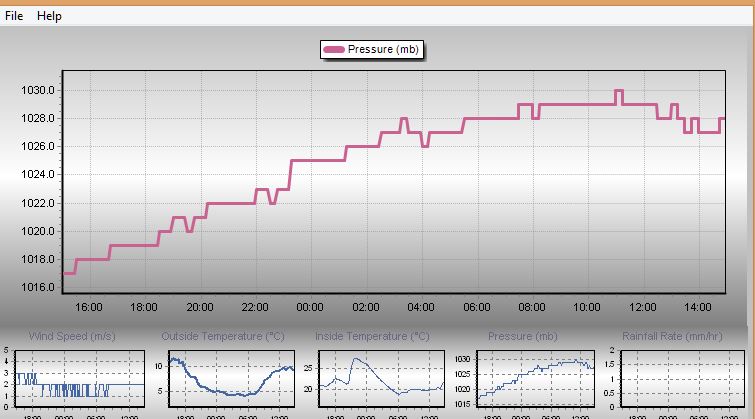
So it is a 'feature' of the station then?steve wrote:Oregon Scientific weather stations have a pressure resolution of 1 mb. The temperature resolution is 0.1 C.
- steve
- Cumulus Author
- Posts: 26701
- Joined: Mon 02 Jun 2008 6:49 pm
- Weather Station: None
- Operating System: None
- Location: Vienne, France
- Contact:
Re: "Blocky" Pressure Graph
It's the stated specification of the pressure sensor - it can only ever be a whole number of mb. The graph reflects that.
Steve
-
- Posts: 556
- Joined: Fri 08 May 2009 3:12 pm
- Weather Station: Davis Vantage Vue
- Operating System: Windows 10
- Location: Pembrokeshire West Wales UK
- Contact:
Re: "Blocky" Pressure Graph
I really don't like the 'blocky' look of the pressure reading, though I quite understand the reason for it. Perhaps when the charts are next looked at - some way of smoothing it's output would be much appreciated. I've obviously been spoiled by the Fine Offset reading.steve wrote:It's the stated specification of the pressure sensor - it can only ever be a whole number of mb. The graph reflects that.