As I can't afford to have a solar radiation reader, I have been looking around locally for a weather site that provides them. I have just found one within 15km, and I intend negotiating to include their output data on my website (obviously crediting them with a link). However looking at their output and at the Cumulus Radiation Graph I see an apparent anomaly!
http://www.milfordweather.org.uk/index.php
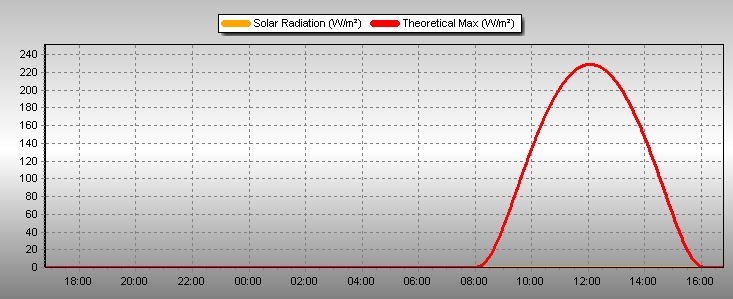
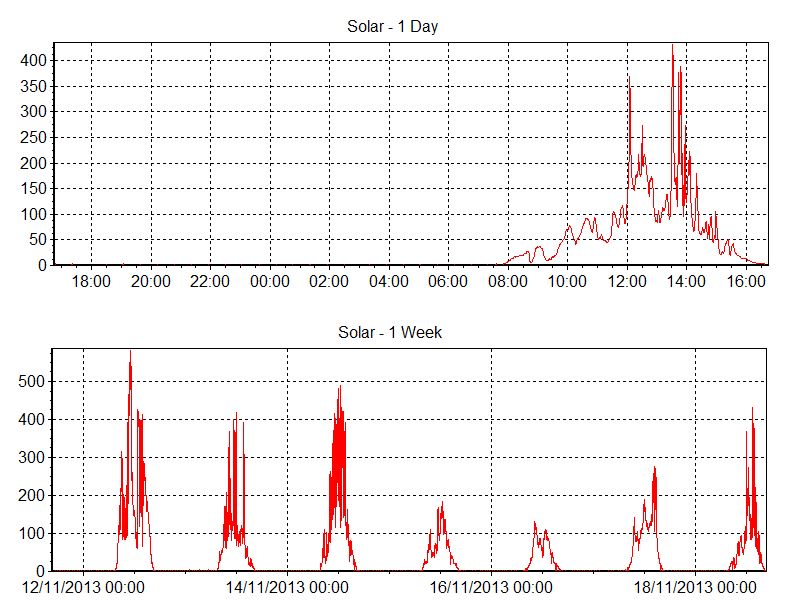
Cumulus seems to assume a an upper possible radiation limit of 230 w/m2, yet the readings displayed by Milford Haven Port Authority ranged up to 450 today. Today was mainly cloudy but did brighten up for while this afternoon.
Welcome to the Cumulus Support forum.
Latest Cumulus MX V3 release 3.28.6 (build 3283) - 21 March 2024
Cumulus MX V4 beta test release 4.0.0 (build 4019) - 03 April 2024
Legacy Cumulus 1 release 1.9.4 (build 1099) - 28 November 2014
(a patch is available for 1.9.4 build 1099 that extends the date range of drop-down menus to 2030)
Download the Software (Cumulus MX / Cumulus 1 and other related items) from the Wiki
Solar Radiation Readings W/m2
- mcrossley
- Posts: 12756
- Joined: Thu 07 Jan 2010 9:44 pm
- Weather Station: Davis VP2/WLL
- Operating System: Bullseye Lite rPi
- Location: Wilmslow, Cheshire, UK
- Contact:
Re: Solar Radiation Readings W/m2
Geoff, you will need a clear cloudless day to compare the readings. I have found the actual reading is strongly affected by clouds, they reflect additional light down to the sensor if the orientation is right. So you often have the situation where a perfectly clear day gives lower readings than one with broken cloud.
The spikeness of those graphs indicates lots of clouds.
- steve
- Cumulus Author
- Posts: 26701
- Joined: Mon 02 Jun 2008 6:49 pm
- Weather Station: None
- Operating System: None
- Location: Vienne, France
- Contact:
Re: Solar Radiation Readings W/m2
And when you do get a clear day, you can if you wish then calibrate the Cumulus settings to try to get the calculated theoretical max closer to the readings you're using. The default settings are just to get you close. Depending on the type of solar sensor they are using, you may not be able to get them to match at all.
Steve