Page 8 of 18

Re: Server Generated Graphs for MX

Posted: Sat 24 Oct 2015 3:28 pm
by mcrossley
Ah, you are using nginx, I think you will have to convert the .htaccess rules to nginx rewrite rules.

There is an on-line converter here, I have never used though.

Edit: Or use the full xxx.php filenames in gauges.js.

Re: Server Generated Graphs for MX

Posted: Sat 24 Oct 2015 6:51 pm
by kapo
Thank You David and Mark!
After Your advices, I got those graphs to work. I changed those pic addresses in gauges.js, and after that they started to work. Only one thing, which is not a big thing is those Windspeed and Cloudbase values. They are different in those graphs than my page's values are (wind is m/s, graph draws mph. Cloudbase is m, graph draws ft). Is it possible to change those graph values? If it is not, or if it is big work, then those values stay. I am so far very grateful for your help. Thank You once more.


regards
kapo

Re: Server Generated Graphs for MX

Posted: Sat 24 Oct 2015 7:18 pm
by steve
I think your graphs are plotting the correct values, it's just the labels that you need to change in graphSettings.php.

$GRAPH['uom'] = array('temp'=>'C', 'rain'=>'mm', 'wind'=>'mph', 'baro'=>'hPa', 'cloudbase'=>'feet');

Re: Server Generated Graphs for MX

Posted: Sun 25 Oct 2015 8:58 am
by kapo
Good morning Steve!
Thank you for your answer in yesterday evening. I was in a sleep then...
But just a moment ago, I found your answer, and I made those changes that you recommended to my problem. And now this problem is corrected. Everything is o.k. now. Thank You Steve. And special thanks for this CumMx. This is really good program. Now I begin to study how this program can be used to make those ftp:s and SQL uploads. Now I use Toolbox and cronjob. It should be fine, if I could do everything with one program. Thank you very much to you Steve. :)


Regards
kapo

Re: Server Generated Graphs for MX

Posted: Tue 08 Dec 2015 6:34 am
by duke
Has any one been having problems with these lately?

I've been busy with other projects lately so have not looked at my site for a few months. Looking today the graph images are no longer being generated on my site although locally works as they did when I installed them. I have re-uploaded all the required files from a previous working back up but the same errors are displayed.

When viewing the php graph file directly there are various time related errors, here's a link to one of the php files -graphTempOut.php

And a link to where the graphs were and should be.

My host is running PHP Version 5.5.29

Any suggestions gratefully received.

Re: Server Generated Graphs for MX

Posted: Tue 08 Dec 2015 9:06 am
by steve
Mine's working OK. Googling that message and jpgraph turns up a lot of hits (many of which are because they are actually exhibiting the problem). This person - http://prefetch.net/blog/index.php/2012 ... s-warning/ - set the date.timezone in his php.ini, possibly yours used to do that but no longer does?

Re: Server Generated Graphs for MX

Posted: Tue 08 Dec 2015 9:58 am
by mcrossley
Possibly your server's PHP version has been upgraded, this is a 'feature' on later versions? As Steve said, on newer versions of PHP set the server default TZ in our php.ini file - you can then override it in individual scripts if need be.

Re: Server Generated Graphs for MX

Posted: Tue 08 Dec 2015 10:25 pm
by duke
Thanks Steve / Mark for your prompt reply.

Firstly, checked my php.ini on my hosts server and the time zone is set correctly - "date.timezone="Europe/London""

Following Steve's link and simply adding "date_default_timezone_set('Europe/London');" to jpgraph.php solved the problem.

thanks.

Re: Server Generated Graphs for MX

Posted: Sat 09 Jan 2016 11:03 am
by mwittl
New addition - graphWindRose.php - For server-side dynamic generation of a Windrose plot .png when using CumulusMX.

First, I want to thank user Mark Crossley (mcrossley) for his excellent .php scripts for the graph scripts from the CumulusMX JSON files. I was running Cumulus and when I converted to CumulusMX, I was missing all the .png files needed for the Saratoga/Cumulus scripts. Mark's graphs filled the void, perfectly! At any rate, the only thing missing was a Windrose .png file. With the Saratoga/Cumulus scripts, a Windrose is used on the page that is launched when the Almanac/Weather Trends link is clicked.

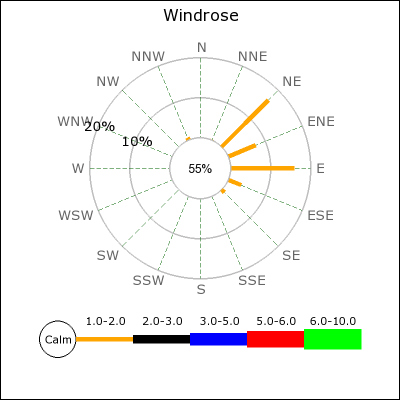
Using mcrossley's scripts as a basis, I created a new .php script that will generate the Windrose from the CumulusMX JSON files. Here is the result:

Image

What's needed:

1.) Mark Crossley's original package for graphic files. Download from 1st posting by Mark on this subject.
2.) jpgraph-3.5.0b1 - Available here: http://jpgraph.net/download/ (Only the src directory is needed which contains a windrose chart)
3.) Modify the jpgraph_windrose.php file to remove the import of 'jpgraph_glayout_vh.inc.php'

Code: Select all

//require_once('jpgraph_glayout_vh.inc.php');
4.) Edit the jp-config.inc.php file to point to the font directory under the installed jpgraph location

Code: Select all

define('TTF_DIR','public_html/entreedata/jpgraph/fonts/');
5.) You may need to locate several TTF fonts found on the internet to this location. Depends if you get any font errors.
6.) Download my graphWindRose.php file and place where you put Mark's other graphic scripts. For me this was /cumulus/images/
7.) Add a line to your .htaccess file to allow calling the script by the .png alias

Code: Select all

RewriteRule ^windrose.png$ graphWindRose.php [NC,L]
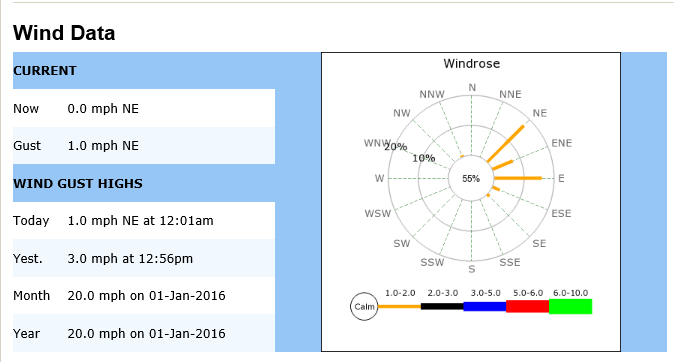
Here is the windrose.png in context of my web site when served up by the Saratoga scripts:
Image

Feel free to look over the script for errors and modify if needed.

SRC for graphWindRose.php

Code: Select all

<?php
/*!
 * Simple static trend graphs for Cumulus MX
 *
 * Created by Mark Wittl, January 2016
 * based on originals by Mark Crossley, January 2015
 *
 * Released under GNU GENERAL PUBLIC LICENSE, Version 2, June 1991
 * See the enclosed License file
 *
 * File encoding = UTF-8
 *
 */

require_once 'graphSettings.php';

$name = basename($_SERVER['PHP_SELF'], '.php').'.png';


//fetch the data
$w1 = get_data('wdir');
$w2 = get_data('wind');

$datay = $w1['bearing'];
//$datay1 =$w2['wspeed'];
$datay1 =$w2['wgust'];
//**************************************************************************************************************************************************
//You have to call two variables from the clientraw, the winddir($datay) and the speed($datay1).
//The rest of the script is clearly explained at the jpgraph website.


// Loop through raw data arrays and place data into the appropriate arrays
// depending on their wind direction
for ($ii = 0; $ii < count($datay); $ii++){
	switch($datay[$ii]){
		case ($datay[$ii] >= 348.75 or $datay[$ii] < 11.25):
			$direction_array["N"][] = $datay1[$ii];
			break;
		case ($datay[$ii] >= 11.25 and $datay[$ii] < 33.75):
			$direction_array["NNE"][] = $datay1[$ii];
			break;
		case ($datay[$ii] >= 33.75 and $datay[$ii] < 56.25):
			$direction_array["NE"][] = $datay1[$ii];
			break;
		case ($datay[$ii] >= 56.25 and $datay[$ii] < 78.75):
			$direction_array["ENE"][] = $datay1[$ii];
			break;
		case ($datay[$ii] >= 78.75 and $datay[$ii] < 101.25):
			$direction_array["E"][] = $datay1[$ii];
			break;
		case ($datay[$ii] >= 101.25 and $datay[$ii] < 123.75):
			$direction_array["ESE"][] = $datay1[$ii];
			break;
		case ($datay[$ii] >= 123.75 and $datay[$ii] < 146.25):
			$direction_array["SE"][] = $datay1[$ii];
			break;
		case ($datay[$ii] >= 146.25 and $datay[$ii] < 168.75):
			$direction_array["SSE"][] = $datay1[$ii];
			break;
		case ($datay[$ii] >= 168.75 and $datay[$ii] < 191.25):
			$direction_array["S"][] = $datay1[$ii];
			break;
		case ($datay[$ii] >= 191.25 and $datay[$ii] < 213.75):
			$direction_array["SSW"][] = $datay1[$ii];
			break;
		case ($datay[$ii] >= 213.75 and $datay[$ii] < 236.25):
			$direction_array["SW"][] = $datay1[$ii];
			break;
		case ($datay[$ii] >= 236.25 and $datay[$ii] < 258.75):
			$direction_array["WSW"][] = $datay1[$ii];
			break;
		case ($datay[$ii] >= 258.75 and $datay[$ii] < 281.25):
			$direction_array["W"][] = $datay1[$ii];
			break;
		case ($datay[$ii] >= 281.25 and $datay[$ii] < 303.75):
			$direction_array["WNW"][] = $datay1[$ii];
			break;
		case ($datay[$ii] >= 303.75 and $datay[$ii] < 326.25):
			$direction_array["NW"][] = $datay1[$ii];
			break;
		case ($datay[$ii] >= 326.25 and $datay[$ii] < 348.75):
			$direction_array["NNW"][] = $datay1[$ii];
			break;
	}
}

// Some directions may not have any data so this will create an array of the 
// directions that do.
$direction_keys = array_keys($direction_array);

// Calculate max windspeed, used for windrose range
$max_wind = round(max($datay1),0);

// Get the number of data points
$num_data = count($datay1);

// Define the data range array for the windrose, this needs to be done
// ahead of time because some of the computational aspects require this range
$wind_range_max = $max_wind < 20 ? 25:$max_wind;
$data_range_array = array(1,5,10,15,20,$wind_range_max);

// Loop through dirction array based on direction keys and calculate the histogram
// stats for each array.
foreach ($direction_keys as $direction) {

	// Set up counter to determine how many data points there are within each 
	// direction array and wind range.
	for ($ii = 0; $ii <= 5; $ii++){
		$count_data[$ii] = 0;
	}

	// Define raw data to be processed into array counters
	$raw_data = $direction_array[$direction];
		
	// The windrose software needs to know the % of data points that fall into 
	// each range for each wind direction.  
	foreach ($raw_data as $temp_speed) {
		if ($temp_speed >= 0 and $temp_speed < $data_range_array[0]) {
			$count_data[0]++;
		} elseif ($temp_speed >= $data_range_array[0] and $temp_speed < $data_range_array[1]) {
			$count_data[1]++;
		} elseif ($temp_speed >= $data_range_array[1] and $temp_speed < $data_range_array[2]) {
			$count_data[2]++;
		} elseif ($temp_speed >= $data_range_array[2] and $temp_speed < $data_range_array[3]) {
			$count_data[3]++;
		} elseif ($temp_speed >= $data_range_array[3] and $temp_speed < $data_range_array[4]) {
			$count_data[4]++;
		} elseif ($temp_speed >= $data_range_array[4]) {
			$count_data[5]++;
		}
	}
	
	// Place all data in an array that can be used by JPGraph
	// First set up data array
	for ($ii = 0; $ii <= 5; $ii++) {
		$plot_data[$direction][$ii] = 0;		
	}
	
	for ($ii = 0; $ii <= 5; $ii++) {
		$plot_data[$direction][$ii] = ($count_data[$ii] / $num_data) * 100;
	}
		
}


//**************************************************************************************************************************************************
 
// First create a new windrose graph with a title
$graph = new WindroseGraph(400,400);
$graph->title->Set('Windrose');
 
// Create the windrose plot.
$wp = new WindrosePlot($plot_data);
 
// Add and send back to browser
$graph->Add($wp);
$graph->Stroke();

?>
- Mark Wittl
http://www.entreedata.com/weather/roanoke/details/
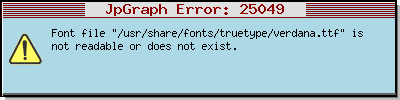
Re: Server Generated Graphs for MX

Posted: Sat 09 Jan 2016 11:51 am
by steve
Nice work!

Re: Server Generated Graphs for MX

Posted: Sat 09 Jan 2016 4:34 pm
by mcrossley
Great stuff, I have a version that works with MySQL as well now (http://weather.wilmslowastro.com/images/windrose.png)

I think you have one step missing, you need to add an include to graphSettings.php...

Code: Select all

include $GRAPH['jpgraphloc'] . "jpgraph_windrose.php";
I had to add arial.ttf and verdana.ttf to the jpgraphs/fonts folder.

Re: Server Generated Graphs for MX

Posted: Sat 09 Jan 2016 9:04 pm
by mcrossley
With Marks permission, I have added his WindRose script to the overall package, so you can download from the GitHub repository.

Thanks again Mark.

Re: Server Generated Graphs for MX

Posted: Tue 26 Jan 2016 8:56 pm
by forestedge
You need to edit the JPGraph config file to enable caching and point it at your cache folder. Then edit the graphSettings.php script and set the cache folder and jpgraph fodler locations in there.
I am struggling to set up the popup graphs and could not see the graphsettings.php script anywhere when downloaded and at the moment no graphs are generated in the cache.
I have uploaded jpgraphs package and defined as below in Windows 7, not sure if this is correct though!

define('CACHE_DIR','/public_html/cache'/');
define('TTF_DIR','/public_html/font'/');
define('USE_CACHE',true);
//('MBTTF_DIR','/usr/share/fonts/TrueType/');//

I also tried changing the website MX gauge colours in the MX gauges.js like I have with Cumulus 1 and they did not display so I had to revert to the default colours.

Any assistance appreciated.

Re: Server Generated Graphs for MX

Posted: Tue 26 Jan 2016 9:51 pm
by mcrossley
forestedge wrote: I am struggling to set up the popup graphs and could not see the graphsettings.php script anywhere when downloaded and at the moment no graphs are generated in the cache.
graphSettings.php is part of the download from this thread, not JPGraphs.
forestedge wrote: I have uploaded jpgraphs package and defined as below in Windows 7, not sure if this is correct though!

define('CACHE_DIR','/public_html/cache'/');
define('TTF_DIR','/public_html/font'/');
define('USE_CACHE',true);
//('MBTTF_DIR','/usr/share/fonts/TrueType/');//
I'd put the full path in, e.g. something like C:/web/public_html/cache/

But you seem to have an extra quote character before the final / at the end of each path above.

I am stumped! Please help me if you can.

Posted: Fri 29 Jan 2016 1:24 am
by UncleBuck
I am at a loss getting these to work on my site......

This is what I have:

Code: Select all

jpgraph.php
(as downloaded)

jpg-config.inc.php
 define('CACHE_DIR',$_SERVER["DOCUMENT_ROOT"].'/site-utils/jpgraph/cache/');
 define('TTF_DIR',$_SERVER["DOCUMENT_ROOT"].'/site-utils/jpgraph/Fonts/');
 define('MBTTF_DIR',$_SERVER["DOCUMENT_ROOT"].'/site-utils/jpgraph/Fonts/');

.httaccess
(as downloaded) and placed in the images folder.

gauges.js
imgPathURL        : 'images/',
Now the problem:
Trying the JpGraph examples testsuit.php shows no images (except one) and one error in the server logs which is
PHP Fatal error: require_once(): Failed opening required 'jpgraph/jpgraph_odo.php' (include_path='.:')
(Take a look for yourself at http://www.pcweather.kcsolutions.com.au ... stsuit.php)
Of the 559 tests, only 36 images are created in the cache.
Test 6 result shows an image BUT it is not in the cache.

Trying the gauges-ss-basic.htm file (http://www.pcweather.kcsolutions.com.au ... -basic.htm) produces 9 images in the cache BUT the log file shows an "Undefined index: uom" error in the graphWind.php file.
Calling any image directly from the images folder such as http://www.pcweather.kcsolutions.com.au/images/temp.png results in the image being created in the cache but not displayed on screen (indicating that the .httaccess is working correctly).

Any ideas as to what the problem may be would be greatly appreciated.

Colin.

Further investigation has shown the following:
Even though the image gets created in the cache folder when you call http://www.pcweather.kcsolutions.com.au ... aphhum.php, if you do this using Firefox it displays the message
The image “http://www.pcweather.kcsolutions.com.au ... aphhum.php” cannot be displayed because it contains errors.
If you call the direct link to the cached image using Firefox (i.e. http://www.pcweather.kcsolutions.com.au ... aphhum.png) then it displays the image as it should.